Ride-hailing companies and public transportation are notoriously busy on U.S. holidays that traditionally involve alcohol, with surging fares for the former and dramatic waiting times for the latter on New Year’s Eve, Halloween, and St. Patrick’s Day, in particular. To see how this behavior impacted traffic, Drivemode took a look at 2018 driving trends comparing St. Patrick’s Day in 2018, which occurred on a Saturday, to the average Saturday in the first half of 2018.
Drivemode reviewed the data of over 749K anonymized Android users from 2018, producing over 457.5 million points of anonymous GPS location data. With this information, Drivemode used the geographic perimeter of each city to find the averaged aggregated duration of driving sessions on St. Patrick’s Day 2018 as compared to an average Saturday during the first six months of the year.
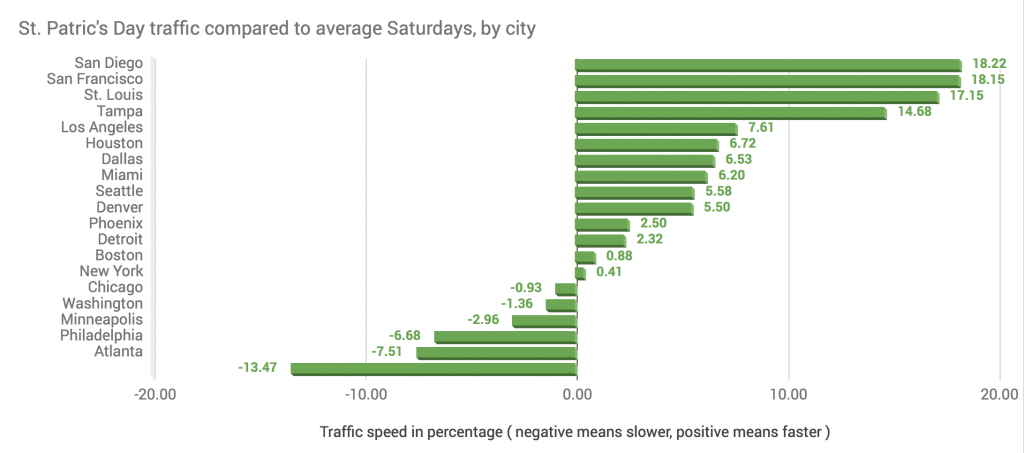
On St. Patrick’s Day nationwide, we see traffic overall moving 7.44 % slower than compared to other Saturdays. At a metro level, we see significant variation in traffic, showing that St. Patrick’s Day indeed has a traffic impact on certain cities, with or without a parade on that day.
Atlanta motorists endured the nation’s most sluggish St. Patrick’s Day roadways, with travel nearly 14% slower than a typical Saturday, followed by Philadelphia and Minneapolis, suggesting drivers in those metros were out and about in their own cars, whether there was a parade or not. In contrast, driving conditions in San Diego, San Francisco and St. Louis were brisker than average on St. Patrick’s day, indicating residents there may have been staying off the roads entirely or using public transportation. Chicago, New York, Boston, and Detroit were all within 2% of average traffic speeds, suggesting that St. Patrick’s Day had little effect on those cities—even with two of the biggest parades in the U.S. hosted in Chicago and NYC.
“Motorists who enjoy faster traffic on St. Patrick’s Day would likely be due to an interesting mix of motivators. Some folks want to celebrate out at the bars and take public transportation or ride-hail to avoid drinking and driving,” said Yo Koga, CEO and co-founder of Drivemode. “Others who might have otherwise gone out on a Saturday want to avoid the holiday revellers altogether and just stay home. The result— a relatively quicker drive on the holiday.”
|
CITY |
ST. PATRICK'S DAY COMPARED TO AVG SATURDAY |
|
San Diego |
18.15% faster |
|
San Francisco |
17.15% faster |
|
St. Louis |
14.68% faster |
|
Tampa |
7.61% faster |
|
Los Angeles |
6.72% faster |
|
Houston |
6.53% faster |
|
Dallas |
6.20% faster |
|
Miami |
5.58% faster |
|
Seattle |
5.50% faster |
|
Denver |
2.50% faster |
|
Phoenix |
2.32% faster |
|
Detroit |
0.88% faster |
|
Boston |
0.41% faster |
|
New York |
0.93% slower |
|
Chicago |
1.36% slower |
|
Washington |
2.96% slower |
|
Minneapolis |
6.68% slower |
|
Philadelphia |
7.51% slower |
|
Atlanta |
13.47% slower |