Is Valentine’s Day still an occasion to go out for a fancy dinner and a show with your sweetheart, or is the “Netflix and chill” trend having an impact on the most romantic day of the year? Drivemode took a look at 2018 driving trends comparing Valentine’s Day to weekdays in February to see if there were a notable impact on the day’s traffic.
Drivemode reviewed the data of over 749K anonymized Android users from 2018, producing over 457.5 million points of anonymous GPS location data. With this information, Drivemode used the geographic perimeter of each city to find the averaged aggregated duration of driving sessions on Valentine’s Day 2018 as compared to an average weekday in February.
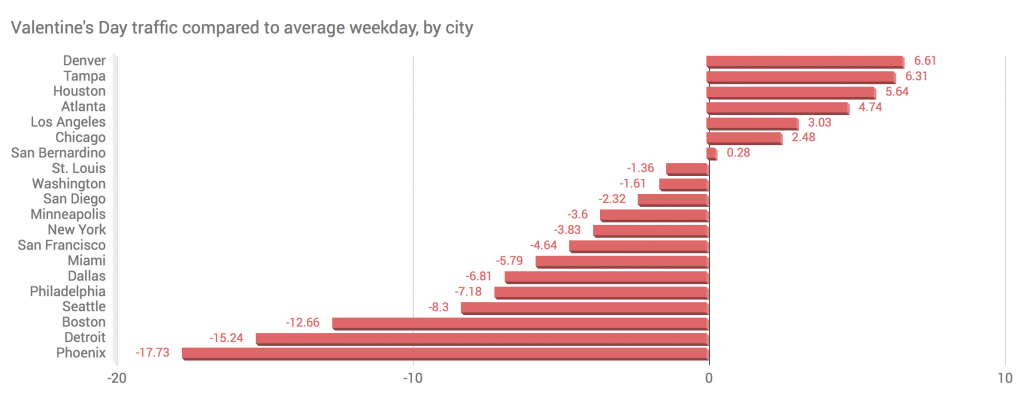
On Valentine’s Day nationwide, we see traffic slowing down by only 3% compared to other weekdays in February. But at a metro level, we see much more variation in traffic, showing that Valentine’s Day indeed has a traffic impact on certain cities. Half of the large cities we analyzed were comparable to an average weekday, with under 5% difference in traffic behavior. However, the other ten cities showed notable differences for Valentine’s Day.
Motorists in Phoenix endure the nation’s most sluggish V-day roadways, with travel nearly 18% slower than a typical February weekday. Detroit, Boston, Seattle and Dallas round out the top five slowest V-day cities, suggesting residents in those metros are hitting the town in high numbers for date-night romance. In contrast, driving conditions in Denver, Tampa and Houston are brisker than average on Valentine’s Day, indicating residents there may be staying off the roads and hunkering down at home with their honeys.
“Insofar as we can attribute a faster drive to less traffic on the road, it would seem that drivers in several major cities-—notably Phoenix, Detroit, and Boston—are out in higher numbers on Valentine’s Day than they are on other days,” said Yo Koga, CEO and founder of Drivemode.
“For those going out, it is likely that both the comfort and perception of public transportation may inform these trends. In some cities, taking public transportation, and therefore reducing traffic on the road, is completely normal for commuting but may not be acceptable or comfortable for a date night. In the cities where traffic is faster on Valentine’s Day, or not notably impacted, this may indicate more people staying home, or more normalized public transportation which is acceptable to use for a romantic night out.”
| City | Valentine's Day traffic compared to average February weekday |
| Phoenix | 17.73% Slower |
| Detroit | 15.24% Slower |
| Boston | 12.66% Slower |
| Seattle | 8.30% Slower |
| Philadelphia | 7.18% Slower |
| Dallas | 6.81% Slower |
| Miami | 5.79% Slower |
| San Francisco | 4.64% Slower |
| New York | 3.83% Slower |
| Minneapolis | 3.60% Slower |
| San Diego | 2.32% Slower |
| Washington | 1.61% Slower |
| St. Louis | 1.36% Slower |
| San Bernardino | 0.28% Faster |
| Chicago | 2.48% Faster |
| Los Angeles | 3.03% Faster |
| Atlanta | 4.74% Faster |
| Houston | 5.64% Faster |
| Tampa | 6.31% Faster |
| Denver | 6.61% Faster |
Drivemode compared metro areas using the number of minutes it takes an average driver to drive one mile on Valentine’s Day versus an average February weekday.